Viewing Reports and Comparative Filter
Keen to learn more about our reports and our powerful comparative filters? Then this is the article for you.
In this article we’ll cover the Campaign Report in detail and how you can use comparative filters. If you’d like to learn more about our dashboard report you can look at our article Understanding The Dashboard
Getting into the Campaign Report:
Once you’ve sent a campaign, you’ll want to review the campaigns results. On the Campaigns page, select the campaign you’d like to review.
The first section of the report shows you an overview of your campaign and includes your Campaign Name and Subject Line.

VIEW WEB VERSION
The online version of your campaign template will be available at this link. If you have included a web version tag in your campaign template, a subscriber will be taken to this page if they click on the Web Version/View Online/View in Browser link.
EXPORT STATS
If you’d like to download the overview statistics of your campaign, select the EXPORT STATS button. You’ll have the option to export the data as a CSV or PDF file, depending on your preference.

CAMPAIGN REPORT SUMMARY
The campaign report summary covers the stats of your campaign across your Open Rate, Bounce Rate, Clicks To Opens and Unsubscribe Rate.
OPEN RATE
The open rate is the percentage of subscribers who have opened your email. It is calculated by dividing the number of people who opened your email by the total number of subscribers who received it. To explore deeper insights, click the dropdown arrow in the upper right corner of the Open Rate section and select “View Details.”

This will show you the following breakdown:
- Unique Opens: The total number of individual subscribers who opened the email at least once. Each subscriber is counted only once, no matter how many times they open the message.
- All Opens: The total number of times the email was opened, including multiple opens from the same subscriber. This helps you gauge repeat engagement.
- Mobile Opens: The total number of email opens that occurred on mobile devices. This helps you understand what portion of your audience is engaging with your content on the go, which is useful for optimising mobile-friendly designs.
- Open To Clicks: This shows the number of people who clicked on a link after opening the email. It's a key indicator of how compelling your content is once it grabs the subscriber’s attention.
On the Opens Report page, you’ll see a list of subscribers that have opened your email.

Subscribers might have opened your email more than once, so you’ll see a record for each time they opened the campaign. Select EXPORT REPORTS to download these statistics.
If you only need to see the individual subscribers that have opened your email at least once, select UNIQUE OPENS. On the Unique Opens Report page, you’ll see the subscribers that have opened your email, and also how many times they opened it.
It’s important to note that if you see very high numbers of opens for a subscriber, this is due to security software scanning the email.
Select EXPORT REPORTS to download these statistics.
Select CAMPAIGN OVERVIEW to go back to the campaign dashboard.
CLICKS TO OPENS
The clicks-to-opens percentage is calculated by dividing the number of subscribers who opened your email and clicked on a link by the total number of people who received your message. It represents the proportion of recipients who engaged with the in-mail links in your campaign.
To view detailed information about the clicks rate performance, click on the down arrow icon in the upper right of the section, select VIEW DETAILS.

On the Clicks Report page, you’ll see a list of the links that are in your email template. You’ll also see the number of times the link was clicked.
Security software scan emails and their content can sometimes add to very high numbers of clicks, so if you do notice excessive statistics, it is likely due to that.
Select EXPORT REPORTS to download these statistics.
Select CAMPAIGN OVERVIEW to go back to the campaign dashboard.
BOUNCE RATE
The bounce rate is the percentage of email addresses that generated an error after being sent.
Bounces are emails that were unable to be delivered to a subscriber. There are many reasons why bounces occur, and sometimes the subscriber’s email server gives more information as to why the mail was rejected, but it depends on their network.
To view detailed information about the bounce rate, click on the down arrow icon in the upper right of the section then select VIEW DETAILS.

On the Bounce Rate page, you’ll see a list of email addresses that were unable to be reached.
In the Message column, you’ll see the response from the subscriber’s email server or network. In some cases, it provides details that were the reason for the rejection.
In the Bounce Type column you’ll see which type of bounce occurred. There are 3 types of bounces:
Hard: Usually due to an issue with the subscriber’s email address.
Soft: A temporary bounce usually due to a subscriber’s email server or inbox being unavailable.
Internal: Either an issue with the IP address that sent the email (possibly due to a temporary blacklisting) or an issue with the subscriber’s email network.
Bounces play a vital role in email marketing. Good delivery rates depend on the reputation of both the sender and the IP address that the email comes from. Therefore, bounces are often filtered onto your account blacklist after a number of failed attempts to reach a subscriber’s inbox. The reason being, that if a sender continues to send emails to a subscriber unsuccessfully, the reputation of the sender and accompanying IP address gets damaged. This results in poorer delivery for future email campaigns.
Download the bounce reports by selecting EXPORT REPORTS.
UNSUBSCRIBE RATE
To view detailed information about the unsubscribe rate, click on the down arrow icon in the upper right of the section, select VIEW DETAILS.
Subscribers that opt-out of receiving your emails, will be displayed on your unsubscriber reports. They sometimes explain why they have made this decision in the Reason column.

Select EXPORT REPORTS to download the report.
INBOX SERVICE PROVIDER BREAKDOWN
We’ve added a new section to your campaign reports that shows the Inbox Service Provider breakdown. This provides insights into which email providers (e.g., Gmail, Outlook, Yahoo, etc.) your emails were delivered to, helping you better understand where your subscriber is reading your messages. This data is included when you export your report as a CSV or PDF file.
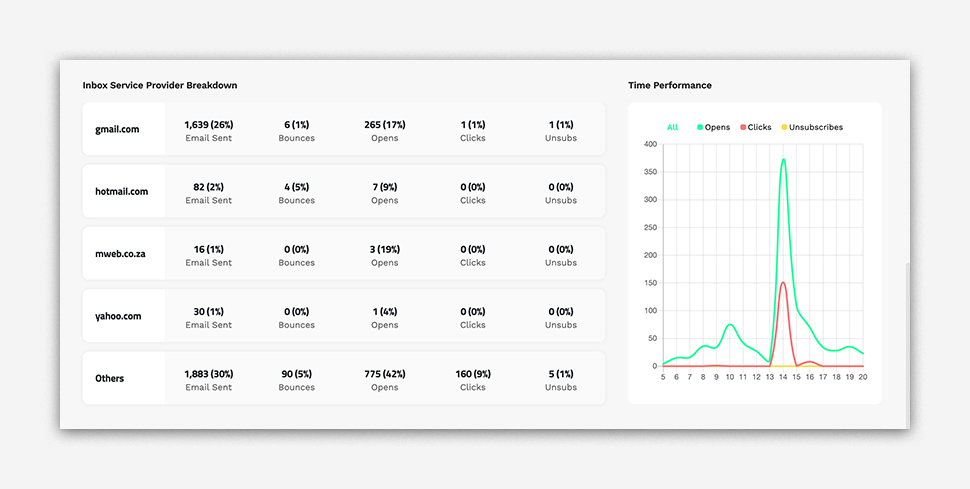
TIME PERFORMANCE
The Time Performance section shows the number of opens, clicks, and unsubscribes that occurred between 5:00 AM and 8:00 PM. This allows you to track recipient activity and engagement throughout the day.
PLEASE NOTE: The time range of 5:00 AM to 8:00 PM is fixed and cannot be changed.
This insight helps you identify peak engagement hours, which can be useful for planning the timing of future campaigns.
If you’d like to use our comparative filters you can do so by doing the following.
USING OUR COMPARATIVE FILTERS
We've created comparative filters for you to use when reviewing your Campaign Reports. This gives you the power to directly compare the performance of two campaigns side by side, so you can easily see what’s working and where there’s room for improvement.
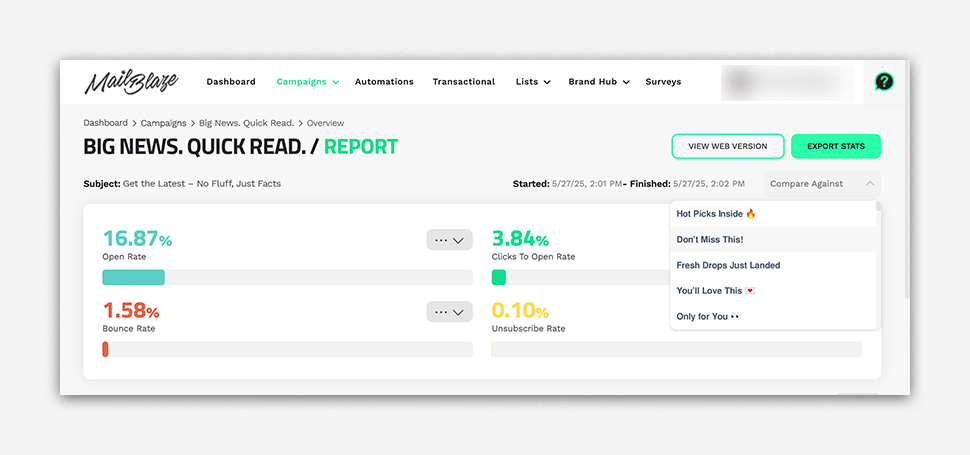
When viewing a campaign, simply click Compare Against and the system will show you a breakdown of the key metrics side-by-side of key performance metrics such as Open Rate, Clicks to Open Rate, Bounce Rate and Unsubscribe Rate. In addition to these core metrics, you’ll also gain insights into:
- Reading Environment Breakdown (mobile, webmail or desktop)
- Total Recipients, Processed, Last Opens and Total Delivery Time
- Latest Opens, Latest Click Links, Top Clicked Links and Subscribers with the Most Opens
- Inbox Service Provider Breakdown and Time Performance
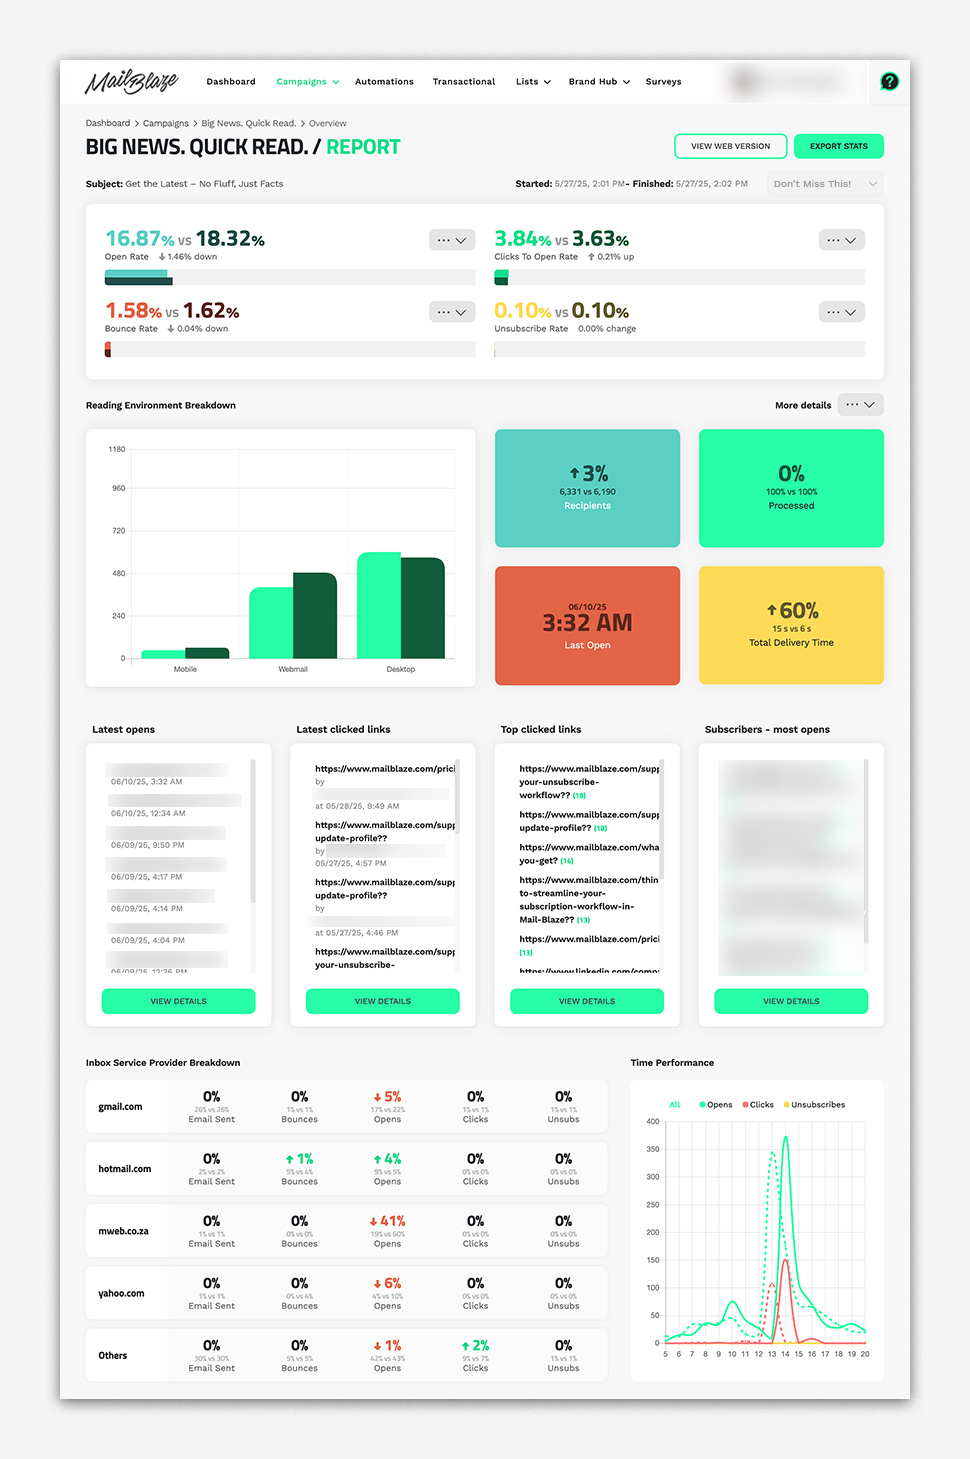
With the Comparative Report, you can easily spot performance trends across campaigns, uncover which subject lines, content types, and designs drive results, and make smarter, data-driven decisions. It also helps you monitor list quality and audience engagement over time.
The last section of the campaign report covers the CAMPAIGN MAP.
CAMPAIGN MAP
Campaign Map gives you a visual breakdown of where your opens and clicks are coming from. This helps you better understand geographic engagement and tailor future campaigns accordingly.
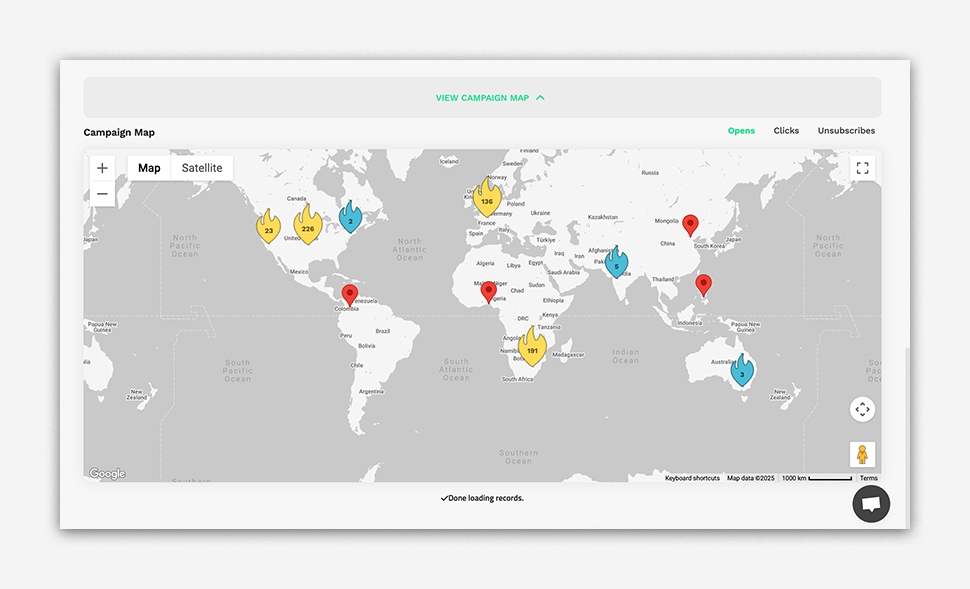 PLEASE NOTE: While the Campaign Map provides valuable insight, geographic data may not always be 100% accurate. Factors such as the use of VPNs, proxy servers, mobile networks, or privacy settings in email clients can affect location detection. Additionally, some email providers may route activity through centralised servers, which can misrepresent the actual geographic source.